Led UX strategy and product design for Ford’s global cost-savings platform, transforming fragmented idea tracking into a unified system that enabled multi-million-dollar material savings and significantly reduced manual reporting.
Role: Lead Product Designer & UX Strategist
Company: Ford Motor Company (via VML)
Timeline: 18 months
Scope: Enterprise data platform, global teams (US, India, Brazil)
Cost Ideas Authority
a journey from tech driven to human centered design
Role: Lead Product Designer & UX Strategist
Company: Ford Motor Company (via VML)
Timeline: 18 months
Scope: Enterprise data platform, global teams (US, India, Brazil)
Impact at a Glance
-
Enabled multi-million dollar material cost savings across Ford's global teams
-
Reduced manual reporting effort by ~90%, saving hundreds of hours annually
-
Reversed a sub-1% adoption rate from a failed predecessor platform
-
Collected 300+ data points across 10 teams and 4 stakeholder groups
The platform also established Ford's first human-centered design practice within the Global Data & Analytics team — a lasting organizational change beyond the product itself.
My Role & Scope
I served as Lead Product Designer and UX Strategist, responsible for both the product direction and introducing human-centered design as a practice to a team that had never used it. My engagement was intentionally time-bound, with the explicit goal of upskilling the team so they could sustain research-driven development after my departure.
-
Introduced and operationalized human-centered design across the full team — from decision makers to developers
-
Led all user and industry research: 24 user interviews, 5 product interviews, surveys, competitive analysis, affinity mapping
-
Designed the data visualization and reporting framework
-
Owned end-to-end experience design: IA, flows, wireframes, prototypes, UI
-
Conducted usability testing and A/B experimentation
-
Built the business case for investment and resourcing
-
Facilitated stakeholder alignment and executive presentations
-
Mentored team members to sustain design maturity after handoff
The Problem
Ford's material cost savings process was fragmented across Excel, SharePoint, and local databases. There was no single source of truth, no consistent process, and no reliable way to capture, validate, or prioritize ideas at scale. The consequences were financial and cultural: high-value ideas were lost or never fully vetted, leadership lacked visibility into potential savings, and teams had become so siloed that employees hoarded ideas in private spreadsheets for fear of not receiving credit.
Employees had even coined a name for it: the "Excel Archipelago" — a scattered collection of individually managed sheets, each an island unto itself, collectively undermining the organization's ability to save money at scale.
A previous internal platform had attempted to solve this. Its adoption rate: under 1%. It was known internally as part of the "GDIA Product Graveyard." That failure set the tone for everything — users were skeptical, leadership was cautious, and the bar for this new effort was high.
As Ford accelerated its transition from a manufacturing company to a technology-driven organization, the absence of a unified, people-first platform had become a critical barrier to scaling material cost optimization globally.

The Real Challenge
The hardest part of this project wasn't the design — it was creating the conditions for good design to happen.
On my first day, I was asked for wireframes before a single conversation had taken place about what would actually benefit users. The team's instinct was to jump to solutions. Shifting that mindset — from "what are we building" to "what problem are we solving" — required sustained effort, patience, and teaching by doing.
The complexity didn't stop there. The team spanned three continents: developers in Chennai, factory employees in Brazil, and a design and tech team in the United States. Timezone constraints meant we could only meet three times a week, and Brazilian data sovereignty laws required us to build and maintain two identical datasets — adding significant technical and coordination overhead throughout the project.
What looked like a product problem was also an organizational one. And solving it required building trust before building anything else.
Discovery: Teaching the Process by Doing It
Before any research could happen, the team needed a shared understanding of why research mattered. I introduced human-centered design not through a lecture, but through practice — framing it simply as "Design the right thing, and design things right."
We ran a business experience canvas together, bringing the full team into alignment on goals, intended users, and what we actually needed to learn. Then we started talking to people.
What happened next surprised even me. Word spread that interviews were happening — that someone was actually listening — and users began reaching out wanting to share their experiences. The team went from pushing back on research to asking me to do more of it. Over six weeks, we collected 300+ data points across ten teams and four stakeholder groups. Users were candid, critical, and at times almost despondent about the tools they'd been given.
Their words told the story better than any data visualization could:
"It would be great to have one-stop shopping. I have to go to multiple databases just to do my job."
"Good discussion between engineer, cost coach, and estimator — the idea doesn't always get captured and preserved."
"It needs to be simple and minimalist. I shouldn't have to click 8 different filters. I don't know what I'm looking at."
"We spend 40 hours on rejected ideas. It's just painful, because I know those ideas will never make Ford any money."
"The data is only as good as what the user enters. You must force the user to enter certain things."
After being underserved for so long, users finally felt like they were in the driver's seat. And we had put them there.
From Insights to Product Decisions
Synthesis revealed that the core challenge wasn't data fragmentation alone — it was the cognitive and operational burden placed on people managing ideas across broken systems. Every product decision flowed directly from what users told us.
Insight → Decision → Impact
Insight: Teams struggled to consistently capture and preserve ideas across disconnected tools.
Decision: Designed a streamlined idea creation flow with required fields and structured data inputs, aligned with the physical "yellow card" workflow used on factory floors.
Impact: Improved data quality and ensured ideas could be reliably tracked and evaluated — including a mobile version for Brazil factory teams.
Insight: Users could not find ideas referenced in meetings or discussed across teams.
Decision: Built advanced search and filtering with parent–child idea relationships to reflect how ideas actually decompose in the real world.
Impact: Enabled faster discovery, reduced duplicate work, and improved cross-team visibility.
Insight: Reporting was manual and consumed hours of manager time each week.
Decision: Introduced automated, role-based reporting and dashboards tailored to each user group.
Impact: Reduced manual reporting effort by ~90%, freeing significant capacity for higher-value analysis.
Insight: Users were overwhelmed by inconsistent, cluttered interfaces.
Decision: Designed a simplified, data-first dashboard built around the data table as the primary interaction surface.
Impact: Reduced cognitive load and dramatically improved day-to-day usability for technical users.
Insight: Global teams lacked visibility into idea status and ownership across regions.
Decision: Implemented configurable notification preferences and transparent status tracking with documented rationale for decisions.
Impact: Improved cross-regional trust and collaboration across US, India, and Brazil teams.
Key Design Decisions
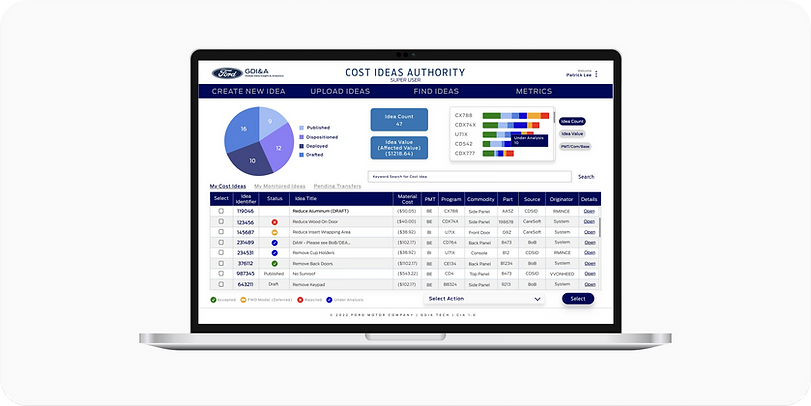
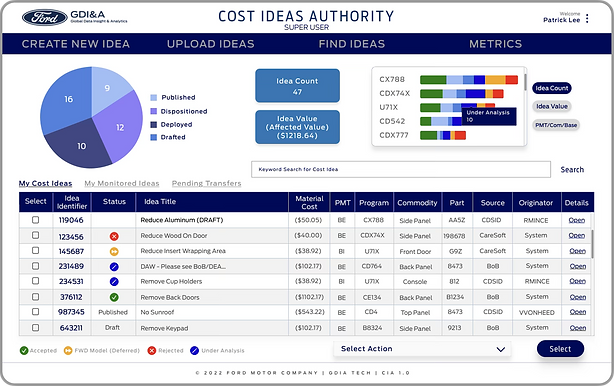
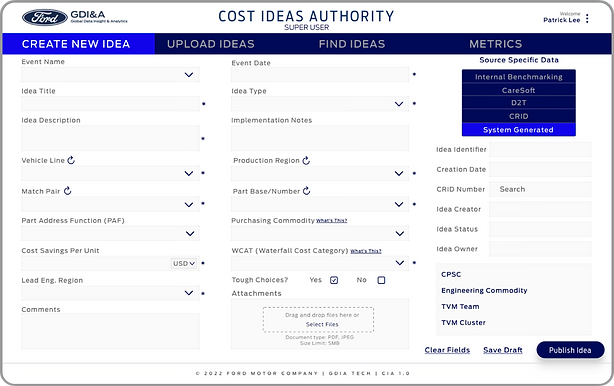
Dashboard: Data First
Users overwhelmingly wanted emphasis on the data table — not charts, not summaries. I designed the dashboard around that instinct, giving users immediate access to the full dataset with quick-action controls that let them act on ideas without navigating away. Surface-level metrics provided at-a-glance status without burying the detail users needed.
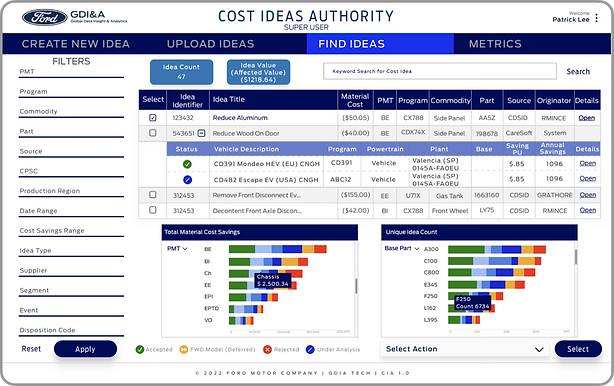
Find Ideas: Scalable Search & Discovery
Before CIA, finding an idea that had been discussed in a meeting meant searching across Excel files, SharePoint folders, and personal inboxes. I designed a high-performance search experience with advanced role-based filtering and parent–child idea relationships — reflecting how ideas actually get broken down and delegated in practice.
Create Idea: Bridging Digital and Physical
The yellow card — a physical notecard used by technicians during factory floor "idea walks" — was the existing mental model for capturing savings ideas. Rather than designing against it, I aligned the digital creation flow with that familiar pattern. Required fields enforced data completeness without adding friction. The Brazil team used this same research to build a mobile version for factory floor input, ensuring continuity across the full idea lifecycle.
Legacy Data Upload
Tens of thousands of ideas existed in Excel documents, SharePoint files, PDFs, and PowerPoint slides. Asking users to manually re-enter all of it wasn't realistic. I designed an intuitive bulk upload flow to migrate legacy data into the system — ensuring the platform had immediate value from day one, not just after months of manual input.

Automated Reporting
Managers were spending roughly eight hours per week manually compiling reports. I eliminated that entirely with role-specific automated reporting — surfacing the metrics most relevant to each user group and embedding direct links back to CIA so users could act immediately from their inbox. Accessibility was a priority throughout; after interviews surfaced "visual boredom" with existing tools, intentional use of color brought clarity and even a measure of joy to daily work.

Impact & Outcomes
The Cost Ideas Authority platform transformed how Ford teams capture, evaluate, and act on material cost-saving opportunities. But the impact extended beyond the product itself.
Business & Operational
-
Enabled multi-million-dollar material cost savings by surfacing ideas that had previously been lost or deprioritized
-
Reduced manual reporting effort by ~90% across global teams
-
Replaced fragmented Excel and SharePoint workflows with a single source of truth
-
Eliminated duplicate work and idea loss across ten teams and four stakeholder groups
Adoption & Experience
-
Achieved strong cross-functional adoption — a significant turnaround from the predecessor platform's sub-1% rate
-
Reduced cognitive load for highly technical users through simplified, data-first design
-
Improved cross-regional collaboration across US, India, and Brazil teams
Organizational
-
Introduced and embedded human-centered design practices in a historically tech-driven team
-
Upskilled the team to sustain research-driven product development after my departure
-
Recognized by Ford stakeholder Patrick Lee and VMLY&R for the quality and impact of the work
What I Learned
This project taught me that the hardest design problems aren't interaction problems — they're organizational ones. The most important work I did in the first month wasn't on a screen; it was building enough trust that a skeptical team would slow down and listen to their users before reaching for solutions.
If I were starting over, I'd push even harder to involve the Brazil team earlier in the research process rather than sharing findings after the fact. Timezone constraints made real-time collaboration difficult, but the mobile yellow card experience would have been stronger with more direct input from the factory floor employees who used it.
I left this project knowing I learned far more than I taught. A group of people from different departments, countries, and disciplines — smashed together and skeptical of each other — became a genuinely well-orchestrated team. That's the outcome I'm most proud of.